I will be showcasing how to setup CAINE for a virtual Forensics lab. CAINE is a great tool for digital forensics as it comes pre-packaged with tools such as Autopsy and Volatility. Also I will do a quick demo following the training “Forensic Analysis: Network Incident Response” by ENISA (https://www.enisa.europa.eu/topics/trainings-for-cybersecurity-specialists/online-training-material/technical-operational/#Forensic_analysis_Network_Incident_Response).
Requirements
For this setup, you will need the following:
- CAINE iso (https://www.caine-live.net/)
- VirtualBox (https://www.virtualbox.org/)
- An evidence drive (Example: http://enisa.europa.eu/ftp/ENISA-Ex2-Evidence.vmdk)
Setup
You don’t have to install CAINE since normally you would use it live but it’ll make things faster for exercises within a virtual environment.
If you do install CAINE inside a VM then you may encounter a problem with GRUB. To fix the GRUB bootloader issue, please follow the tutorial at https://www.youtube.com/watch?v=atHr2OGCQiQ&t=1s&ab_channel=CyberEntirety
Other than that you should be able to boot up your CAINE VM with ease. You may want to change the display resolution to suit your screen. Alternatively, you can install the virtualbox guest additions which automatically adjusts the screen resolution for you.
If you have installed CAINE, make sure you take a snapshot of your CAINE VM after your setup.
Demo
For this demo I will be using an image from ENISA’s training website on “Forensic Analysis: Network Incident Response” (link provided in the Requirements)
Preparing the evidence drive
Before booting up your CAINE VM, you need to add the evidence vmdk drive as a storage device in the CAINE VM settings.
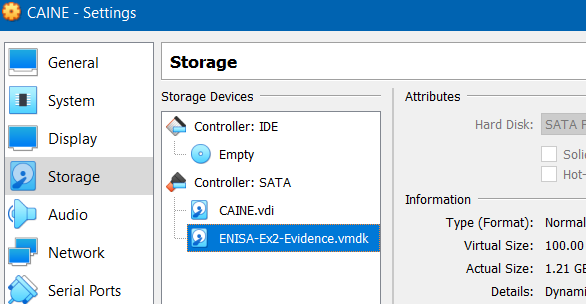 Figure 1: CAINE VM Storage Settings
Boot up and login to your CAINE VM. Next thing you’ll need to do is mount the evidence image. The safest way to mount an evidence drive is by using the Mounter utility in CAINE on the bottom right of the taskbar; this makes sure the device is mounted in read-only to avoid corrupting the drive.
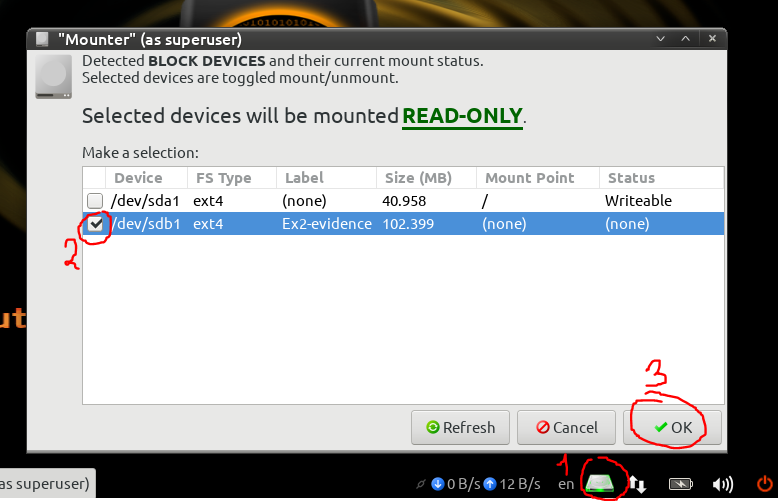 Figure 2: Evidence Mount
Alternatively, you can mount the connected drive through the commands:
1
2
lsblk # to check if device is in sdb1 (it should be by default)
sudo mount /dev/sdb1
Now that we have the evidence drive mounted, we’ll copy the pfsense and dhcpsrv directories to our CAINE VM.
1
2
3
4
5
6
# Create empty directory
cd ~/Desktop/
mkdir forensic-demo && cd forensic-demo
# Copy directories to current directory
cp -r /media/sdb1/pfsense ./
cp -r /media/sdb1/dhcpsrv ./
After this step, you can disconnect the mounted drive if you wish.
Tip: If your VM is slow, you might want to try to ssh into it from your host machine.
1
2
sudo apt-get install openssh-server     # install ssh server
sudo systemctl status sshd              # Check status of ssh daemon
Configure SSH port forwarding in your virtual box network settings: Set the guest port to 22 and your host port to 2222 (or any other port that’s not in use).
Collecting network evidence
In the pfsense directory you will see 3 archives:
log.tar.gz: firewall logsnfdump.tar.gz: netflow dumpsquid-logs.tar.gz: squid proxy logs
We will need to use nfdump to read the netflow dump. Install it with sudo apt-get install nfdump.
Network forensic analysis: nfdump
We are given that the system with IP 192.168.5.100 has been compromised. Using nfdump we will look for clues about the connections related to the victim IP.
We’ll sort by number of flows with -O flows and filter with ip 192.168.5.100 and proto udp:
1
2
3
4
5
6
7
8
9
10
11
$ nfdump -o long -R ./nfdump -A proto,dstport -O flows 'ip 192.168.5.100 and proto udp' | head
Date first seen          Duration Proto      Src IP Addr:Port          Dst IP Addr:Port   Flags Tos  Packets    Bytes Flows
2016-08-16 11:43:05.180 43254.352 UDP            0.0.0.0:0     ->          0.0.0.0:53    ......   0     4406   289737  3970
2016-06-28 02:24:32.625 4307914.637 UDP          0.0.0.0:0     ->          0.0.0.0:8572  ......   0      496    47954   234
2016-08-16 11:43:00.596 40562.491 UDP            0.0.0.0:0     ->          0.0.0.0:5355  ......   0      239    13582   121
2016-06-27 20:54:55.360 4309508.877 UDP          0.0.0.0:0     ->          0.0.0.0:3544  ......   0      507    43359    63
2016-08-16 11:50:31.397 11653.753 UDP            0.0.0.0:0     ->          0.0.0.0:1900  ......   0       92    14766    46
2016-08-16 11:50:08.447 11791.646 UDP            0.0.0.0:0     ->          0.0.0.0:3478  ......   0      133     7448    30
2016-06-28 04:24:32.963 4300365.056 UDP          0.0.0.0:0     ->          0.0.0.0:40018 ......   0       87    15045    28
2016-08-16 11:49:32.177 40336.276 UDP            0.0.0.0:0     ->          0.0.0.0:443   ......   0       24     1104    24
2016-06-27 19:50:20.901 4327722.503 UDP          0.0.0.0:0     ->          0.0.0.0:137   ......   0      415    34098    23
The most udp packets are from DNS traffic (port 53). As for the other ports:
8572: Unassigned5355: LLMNR service3544: Teredo (RFC 4380)1900: UPnP3478: VoIP STUN40018: Used by Microsoft443: HTTPS137: NetBIOS
I used SpeedGuide as a reference for the ports.
Nothing too suspicious so let’s check the TCP packets.

1
2
3
4
5
6
7
8
9
10
11
$ nfdump -o long -R ./nfdump -A proto,dstport -O bytes 'ip 192.168.5.100 and proto tcp' | head
Date first seen          Duration Proto      Src IP Addr:Port          Dst IP Addr:Port   Flags Tos  Packets    Bytes Flows
2016-06-27 20:08:32.485 4319017.104 TCP            0.0.0.0:0     ->          0.0.0.0:12345 ......   0    1.1 M    1.5 G    91
2016-06-27 23:02:11.313 4297677.538 TCP            0.0.0.0:0     ->          0.0.0.0:22    ......   0    75846   89.0 M   250
2016-06-27 22:15:20.176 4294809.218 TCP            0.0.0.0:0     ->          0.0.0.0:50087 ......   0    25889   35.2 M     1
2016-06-27 21:08:52.091 4294720.356 TCP            0.0.0.0:0     ->          0.0.0.0:59694 ......   0    21598   29.1 M     1
2016-06-27 20:19:51.126 4301177.540 TCP            0.0.0.0:0     ->          0.0.0.0:49964 ......   0    15240   20.9 M     3
2016-06-27 22:15:39.248 4294701.500 TCP            0.0.0.0:0     ->          0.0.0.0:50082 ......   0    14692   20.2 M     1
2016-06-27 21:05:43.972 4294783.806 TCP            0.0.0.0:0     ->          0.0.0.0:59628 ......   0    14468   19.5 M     1
2016-06-28 00:37:49.495 4289492.757 TCP            0.0.0.0:0     ->          0.0.0.0:58838 ......   0   295049   12.5 M     1
2016-06-27 22:12:42.597 4294667.462 TCP            0.0.0.0:0     ->          0.0.0.0:50064 ......   0     8330   11.3 M     1
There’s a lot of traffic towards the unusual port 12345. Let’s see where this might lead us:
1
2
3
4
5
6
7
8
9
10
$ nfdump -o long -R ./nfdump -A proto,srcip,dstip,dstport 'src ip 192.168.5.100 and proto tcp and dst port 12345'
Date first seen          Duration Proto      Src IP Addr:Port          Dst IP Addr:Port   Flags Tos  Packets    Bytes Flows
2016-08-16 14:49:41.839  4194.136 TCP      192.168.5.100:0     ->     192.168.5.10:12345 ......   0        2       92     2
2016-06-27 20:08:32.485 4319017.104 TCP    192.168.5.100:0     ->     36.98.102.89:12345 ......   0    1.1 M    1.5 G    85
2016-08-16 14:49:44.104  4194.179 TCP      192.168.5.100:0     ->     192.168.5.15:12345 ......   0        2       92     2
2016-08-16 15:59:31.538     0.115 TCP      192.168.5.100:0     ->      192.168.5.1:12345 ......   0        2       92     2
Summary: total flows: 91, total bytes: 1496690321, total packets: 1122052, avg bps: 2772, avg pps: 0, avg bpp: 1333
Time window: 2016-06-27 02:18:14 - 2016-08-16 23:52:04
Total flows processed: 50089, Blocks skipped: 0, Bytes read: 3719736
Sys: 0.005s flows/second: 9987836.5  Wall: 0.003s flows/second: 16385018.0
The address 36.98.102.89:12345 is the destination of the suspicious traffic.
Now let’s investigate the traffic on the local network:
1
2
3
4
5
6
7
8
9
10
11
$ nfdump -o long -R ./nfdump -A proto,srcip,dstip -O flows 'ip 192.168.5.100 and proto tcp and dst net 192.168.5.0/24' | head
Date first seen          Duration Proto      Src IP Addr:Port          Dst IP Addr:Port   Flags Tos  Packets    Bytes Flows
2016-08-16 14:49:41.996  4207.123 TCP      192.168.5.100:0     ->     192.168.5.15:0     ......   0     2824   129904  2824
2016-06-27 23:02:11.313 4297677.538 TCP      192.168.5.100:0     ->     192.168.5.10:0     ......   0    78176   89.1 M  2572
2016-06-27 23:01:56.613 4297692.238 TCP       192.168.5.10:0     ->    192.168.5.100:0     ......   0    48992    5.3 M  2408
2016-08-16 14:49:44.122  4189.718 TCP      192.168.5.100:0     ->      192.168.5.1:0     ......   0     1893    87078  1893
2016-08-16 11:50:07.935 11798.417 TCP      208.73.211.70:0     ->    192.168.5.100:0     ......   0      242    11132   121
2016-06-27 19:56:31.305 4303049.443 TCP     54.229.228.176:0     ->    192.168.5.100:0     ......   0    34081   46.2 M   114
2016-06-27 20:08:32.485 4319017.104 TCP       36.98.102.89:0     ->    192.168.5.100:0     ......   0   488224   45.0 M    84
2016-06-27 19:55:50.710 4313185.516 TCP        40.115.1.44:0     ->    192.168.5.100:0     ......   0      850   489171    75
2016-06-27 21:00:14.196 4296132.010 TCP     93.184.220.239:0     ->    192.168.5.100:0     ......   0     1679    1.6 M    61
There is a lot of traffic going to the tree addresses 192.168.5.15, 192.168.5.10 and 192.168.5.100.
1
2
3
4
5
6
7
8
9
10
11
$ nfdump -o long -R ./nfdump -A proto,srcip,dstip,dstport -O bytes 'ip 192.168.5.100 and proto tcp and dst net 192.168.5.0/24' | head
Date first seen          Duration Proto      Src IP Addr:Port          Dst IP Addr:Port   Flags Tos  Packets    Bytes Flows
2016-06-27 23:02:11.313 4297677.538 TCP      192.168.5.100:0     ->     192.168.5.10:22    ......   0    75840   89.0 M   244
2016-06-27 22:15:20.176 4294809.218 TCP        13.107.4.50:0     ->    192.168.5.100:50087 ......   0    25889   35.2 M     1
2016-06-27 21:08:52.091 4294720.356 TCP        13.107.4.50:0     ->    192.168.5.100:59694 ......   0    21598   29.1 M     1
2016-06-27 20:19:51.126 4294440.801 TCP     54.229.228.176:0     ->    192.168.5.100:49964 ......   0    15226   20.9 M     1
2016-06-27 22:15:39.248 4294701.500 TCP     54.229.228.176:0     ->    192.168.5.100:50082 ......   0    14692   20.2 M     1
2016-06-27 21:05:43.972 4294783.806 TCP        13.107.4.50:0     ->    192.168.5.100:59628 ......   0    14468   19.5 M     1
2016-06-28 00:37:49.495 4289492.757 TCP       36.98.102.89:0     ->    192.168.5.100:58838 ......   0   295049   12.5 M     1
2016-06-27 22:12:42.597 4294667.462 TCP        13.107.4.50:0     ->    192.168.5.100:50064 ......   0     8330   11.3 M     1
2016-06-27 22:01:12.808 4294888.784 TCP        13.107.4.50:0     ->    192.168.5.100:49913 ......   0     7890   10.8 M     1
We see that there is a lot of ssh packets going to 192.168.5.10.
Let’s check the flows to other ports:
1
2
3
4
5
6
7
8
9
10
11
marwan@marwan-caine:~/Desktop/forensic-demo/pfsense$ nfdump -o long -R ./nfdump -A proto,srcip,dstip,srcport -O flows 'ip 192.168.5.100 and proto tcp and dst net 192.168.5.0/24' | head -O flows 'ip 192.168.5.100 and proto tcp and dst net 192.168.5.0/24' | head
Date first seen          Duration Proto      Src IP Addr:Port          Dst IP Addr:Port   Flags Tos  Packets    Bytes Flows
2016-08-16 14:49:39.451  4196.709 TCP      192.168.5.100:62604 ->     192.168.5.10:0     ......   0     1918    88228  1918
2016-08-16 14:49:41.996  4196.428 TCP      192.168.5.100:41476 ->     192.168.5.15:0     ......   0     1702    78292  1702
2016-08-16 14:49:43.757  4205.362 TCP      192.168.5.100:41477 ->     192.168.5.15:0     ......   0     1122    51612  1122
2016-08-16 15:59:30.431     3.409 TCP      192.168.5.100:39690 ->      192.168.5.1:0     ......   0      946    43516   946
2016-08-16 14:49:44.122  4189.609 TCP      192.168.5.100:39689 ->      192.168.5.1:0     ......   0      944    43424   944
2016-08-16 14:49:41.507  4194.926 TCP      192.168.5.100:62605 ->     192.168.5.10:0     ......   0      410    18860   410
2016-06-27 23:01:56.613 4297692.238 TCP       192.168.5.10:22    ->    192.168.5.100:0     ......   0    46812    5.2 M   244
2016-08-16 11:50:07.935 11798.417 TCP      208.73.211.70:80    ->    192.168.5.100:0     ......   0      242    11132   121
2016-06-27 19:56:31.305 4303049.443 TCP     54.229.228.176:80    ->    192.168.5.100:0     ......   0    34081   46.2 M   114
We notice flows from unusual ports (62604, 41476, 41477, …) on IP 192.168.5.100. There might be some network scanning involved here. Let’s look at the traffic from port 62604:
1
2
3
4
5
6
7
8
9
10
11
$ nfdump -o long -R ./nfdump -O flows 'src ip 192.168.5.100 and src port 62604 and proto tcp and dst net 192.168.5.0/24' | head
Date first seen          Duration Proto      Src IP Addr:Port          Dst IP Addr:Port   Flags Tos  Packets    Bytes Flows
2016-08-16 14:49:39.686  4194.296 TCP      192.168.5.100:62604 ->     192.168.5.10:135   ....S.   0        1       46     1
2016-08-16 14:50:10.198  4163.306 TCP      192.168.5.100:62604 ->     192.168.5.10:53    ....S.   0        1       46     1
2016-08-16 14:50:10.145  4163.300 TCP      192.168.5.100:62604 ->     192.168.5.10:22    ....S.   0        1       46     1
2016-08-16 14:50:10.360  4163.307 TCP      192.168.5.100:62604 ->     192.168.5.10:53    ....S.   0        1       46     1
2016-08-16 14:50:10.308  4163.300 TCP      192.168.5.100:62604 ->     192.168.5.10:22    ....S.   0        1       46     1
2016-08-16 15:59:36.160     0.000 TCP      192.168.5.100:62604 ->     192.168.5.10:1247  ....S.   0        1       46     1
2016-08-16 15:59:36.160     0.000 TCP      192.168.5.100:62604 ->     192.168.5.10:49156 ....S.   0        1       46     1
2016-08-16 15:59:36.159     0.000 TCP      192.168.5.100:62604 ->     192.168.5.10:106   ....S.   0        1       46     1
2016-08-16 15:59:36.159     0.000 TCP      192.168.5.100:62604 ->     192.168.5.10:2033  ....S.   0        1       46     1
This indeed looks like a port scan as we’re seeing 1 packet going to common ports.
Network forensic analysis: Squid Proxy
The Squid proxy files are big, especially the cache.log (692M), so it’s probably better to filter out “normal” traffic. For instance, requests to de.archive.ubuntu.com are likely to be associated with Ubuntu packages being downloaded. Same thing goes for opensuse, openSUSE and novell.com. We can write down filters in a file that can be passed to grep:
1
2
3
4
5
6
7
8
9
10
11
12
13
14
15
16
$ cat filter.txt
ubuntu.com
opensuse
openSUSE
novell.com


$ grep -v access.log -F -f filter.txt
1467994225.265    100 192.168.5.10 TCP_MISS/301 661 GET http://www.dfn-cert.de/index.html - HIER_DIRECT/193.174.13.92 text/html
1467994225.371     96 192.168.5.10 TCP_TUNNEL/200 17744 CONNECT www.dfn-cert.de:443 - HIER_DIRECT/193.174.13.92 -
1467998887.429      3 193.174.12.200 TCP_DENIED/403 3926 GET http://www.heise.de/ - HIER_NONE/- text/html
1468234574.617    266 192.168.5.15 TCP_MISS/200 185310 GET http://www.heise.de/ - HIER_DIRECT/193.99.144.85 text/html
1469198547.567    306 192.168.5.15 TCP_REFRESH_MODIFIED/200 181483 GET http://www.heise.de/ - HIER_DIRECT/193.99.144.85 text/html
1471356766.997     43 192.168.5.10 TCP_MISS/503 4151 GET http://bl/? - HIER_NONE/- text/html
1471356988.431  59783 192.168.5.10 TCP_MISS/503 4163 GET http://blog.mysportclub.ex/wp-content/uploads/hk/files/binaries-only.zip - HIER_DIRECT/54.229.228.176 text/html
1471357647.942  60185 192.168.5.10 TCP_MISS/503 4143 GET http://54.229.228.176/wp-content/uploads/hk/files/binaries-only.zip - HIER_DIRECT/54.229.228.176 text/html
The GET request at the last line shows that binaries-only.zip file has been downloaded from 54.229.228.176 on Tue Aug 16 2016 16:27:27 GMT+0200 (Central European Summer Time) (converted UNIX time 1471357647.942).
The cache.log doesn’t give us any additional information. Here is the updated the filter file if you want to look through the log:
$ cat filter.txt ubuntu.com opensuse openSUSE novell.com ERROR Starting Squid Squid Cache CPU Usage Maximum Resident Size Page faults Service Name: squid FATAL
Conclusion
To recap, we managed to spot a few suspicious activities when analysing the nfdump files:
- Extensive traffic to
36.98.102.89:12345 - Extensive SSH traffic to
192.168.5.10 - port scans (notably from
192.168.5.100:62604)
And we’ve seen on the access.log that a file binaries-only.zip was downloaded from 54.229.228.176 on Tue Aug 16 2016 16:27:27 GMT+0200.
I hope you found this tutorial and demo interesting. I have enjoyed reading through the ENISA’s toolset on Network Incident Response and trying out CAINE. Even though the documents on their website are outdated, they still remain quite useful for those interested in cybersecurity.